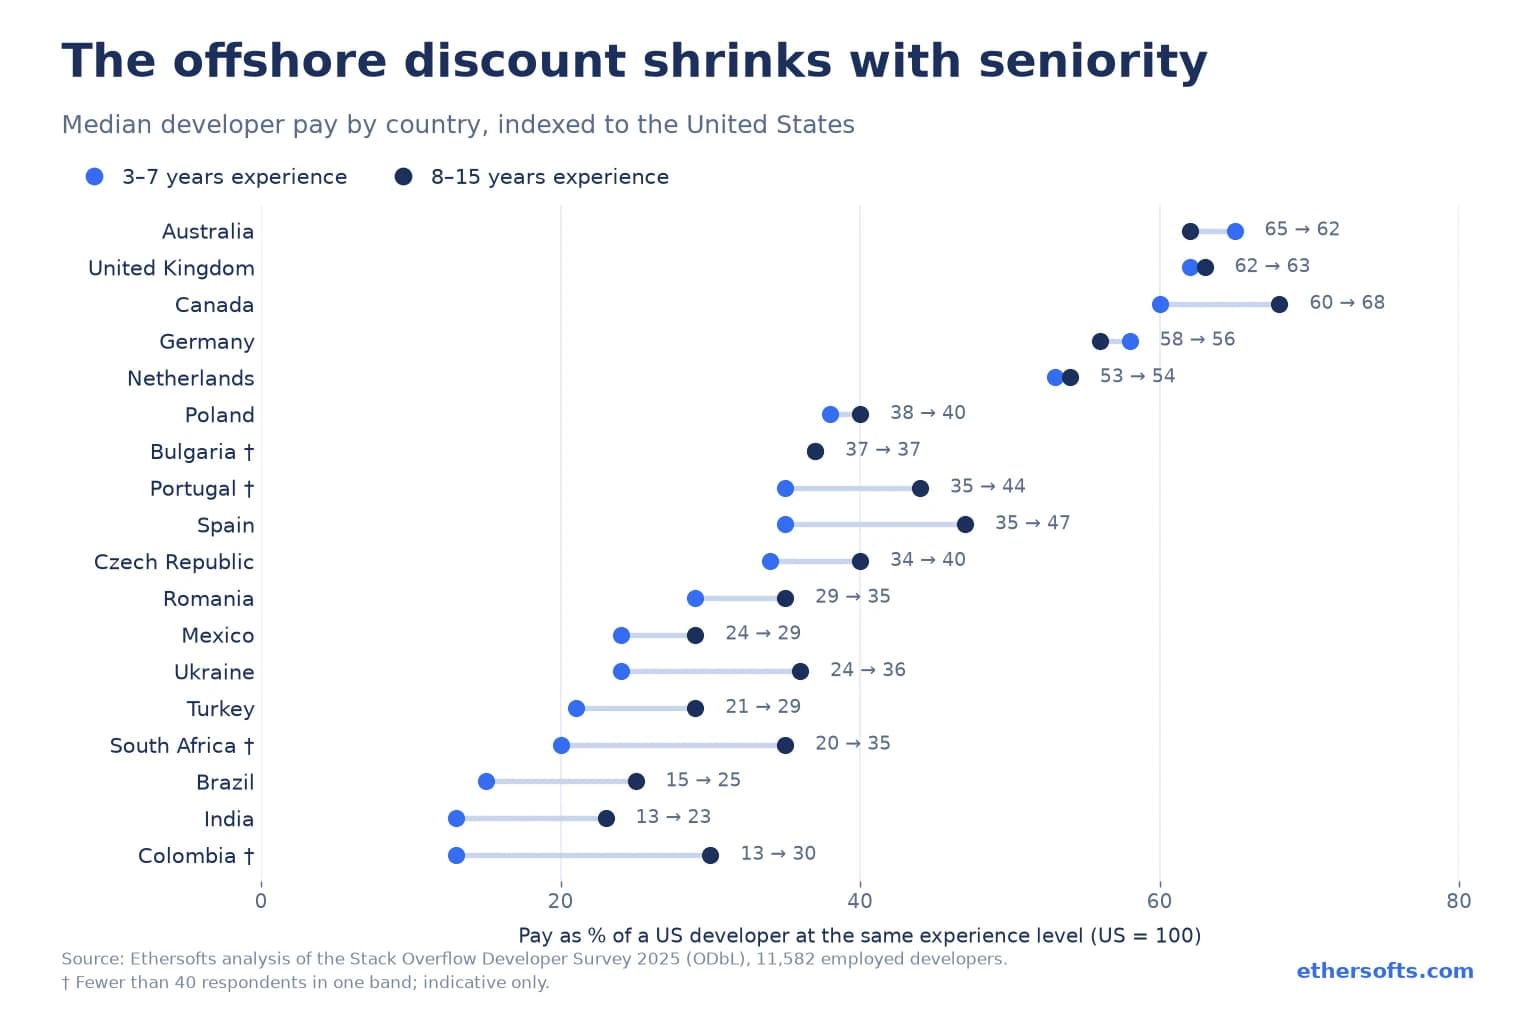
The offshore discount is real, but it is smaller than most rate cards suggest, and it shrinks as seniority rises. A developer in India with three to seven years of experience earns about 13% of a US counterpart. With eight to fifteen years, that figure rises to 23%. Brazil moves from 15% to 25%. Ukraine from 24% to 36%.
That pattern holds across most lower-cost markets in the data, and it changes how you should read any offshore quote. Most of the saving sits in mid-level work. The senior engineers who make architecture decisions cost a much larger share of a US salary than the headline rate implies.
Below is developer cost by country for 21 markets, the arithmetic that produces it, and the full dataset to download. Every figure comes from one open source, so the countries are comparable with each other, which is not true of any rate card assembled from agency marketing pages.
The data and the method
Source. The Stack Overflow Developer Survey 2025, collected May to August 2025. The respondent-level data is published under the Open Database License. Respondents report total annual compensation (salary, bonuses and perks, before tax) in their own currency. Stack Overflow converts it to US dollars at exchange rates dated 24 June 2025.
Filters. We kept respondents who are developers by profession and employed (not freelance or self-employed), with a reported compensation between $1,000 and $1,000,000. That leaves 11,582 people across the 21 countries below. Countries with fewer than 60 qualifying respondents were excluded.
Seniority bands. Mid-level means three to seven years of professional experience. Senior means eight to fifteen. We report the median, not the mean, so a handful of very high earners cannot pull a country upward.
From salary to cost. Salary is not what a developer costs the business employing them. The same model used in our India cost breakdown applies here:
- Multiply compensation by 2.7 to cover employer contributions, equipment, office, management, recruitment, bench time and margin. Professional services firms typically work in the 2.5x to 3x range. This is a rule of thumb, not a measured figure.
- Divide by 1,800 billable hours, which is a 2,080-hour year minus leave, holidays, training and internal work.
The result is the loaded hourly cost: roughly the lowest hourly rate at which a sustainable agency can employ that developer. A quote well below it deserves a question.
Developer cost by country
Sorted by mid-level cost. Index: United States = 100. † marks a band with fewer than 40 respondents; treat it as indicative. A dash means fewer than 20 respondents, too few to report.
| Country | Mid-level loaded $/hr | Mid index | Senior loaded $/hr | Senior index | Senior ÷ mid pay |
|---|---|---|---|---|---|
| India | $22.67 | 13 | $55.80 | 23 | 2.46x |
| Colombia | $22.75 † | 13 † | $73.41 † | 30 † | 3.23x † |
| Brazil | $27.31 | 15 | $60.34 | 25 | 2.21x |
| Pakistan | $18.07 | 10 | — | — | — |
| Argentina | $33.78 † | 19 † | — | — | — |
| South Africa | $36.79 † | 20 † | $84.57 | 35 | 2.30x † |
| Turkey | $38.25 | 21 | $70.08 | 29 | 1.83x |
| Ukraine | $42.48 | 24 | $86.28 | 36 | 2.03x |
| Mexico | $43.27 | 24 | $69.48 | 29 | 1.61x |
| Romania | $51.69 | 29 | $83.95 | 35 | 1.62x |
| Czech Republic | $60.91 | 34 | $98.29 | 40 | 1.61x |
| Spain | $62.65 | 35 | $113.11 | 47 | 1.81x |
| Portugal | $63.41 † | 35 † | $107.89 | 44 | 1.70x † |
| Bulgaria | $67.46 † | 37 † | $88.96 | 37 | 1.32x † |
| Poland | $69.18 | 38 | $98.24 | 40 | 1.42x |
| Netherlands | $95.71 | 53 | $130.52 | 54 | 1.36x |
| Germany | $104.41 | 58 | $137.04 | 56 | 1.31x |
| Canada | $107.25 | 60 | $164.16 | 68 | 1.53x |
| United Kingdom | $112.32 | 62 | $153.16 | 63 | 1.36x |
| Australia | $117.02 | 65 | $151.15 | 62 | 1.29x |
| United States | $180.00 | 100 | $243.00 | 100 | 1.35x |
Download the full table, including sample sizes, medians and quartiles: developer-cost-index-2026.csv. Released under the ODbL 1.0, derived from the Stack Overflow Developer Survey 2025.
Finding 1: senior engineers cost nearly twice the share of US pay
In the United States, a developer with eight to fifteen years of experience earns 1.35 times what one with three to seven years earns. In Germany it is 1.31x. In the UK, 1.36x.
In India it is 2.46x. In Brazil, 2.21x. In Ukraine, 2.03x.
Experience is priced much more steeply in lower-cost markets, so the gap to US pay narrows as you move up the ladder:
| Country | Mid-level saving vs US | Senior saving vs US |
|---|---|---|
| India | 87% | 77% |
| Brazil | 85% | 75% |
| Ukraine | 76% | 64% |
| Mexico | 76% | 71% |
| Poland | 62% | 60% |
The practical consequence: an offshore team heavy with mid-level engineers delivers most of the headline saving. A team built around senior architects delivers noticeably less. If a quote shows a single blended rate, ask for the seniority mix behind it, because the mix moves the bill more than the country does.
A plausible reason, which this data cannot prove: in markets where senior engineers are scarce relative to demand, and where many work for foreign clients or remote employers paying closer to international rates, experience commands a steeper premium. The data shows the pattern. It does not show the cause.
Finding 2: “nearshore Europe” is three price bands, not one
Rate cards usually quote Europe outside the west as a single tier. The data shows three:
| Band | Countries | Mid index | Senior index |
|---|---|---|---|
| Lowest | Ukraine, Turkey | 21–24 | 29–36 |
| Central | Romania, Czech Republic, Bulgaria, Poland | 29–38 | 35–40 |
| Iberia | Spain, Portugal | 35 | 44–47 |
Poland is often treated as the region’s benchmark. Its seniority curve is one of the flattest in the group at 1.42x. Its mid-level engineers are the most expensive in the central band, while its senior engineers sit near the band average. For a senior-heavy team, Poland is not the premium option its reputation implies.
Finding 3: for US buyers, Latin America is cheaper than its reputation at the mid level
Mexico sits at 24% of US mid-level cost and 29% at senior level, with a relatively flat 1.61x seniority curve. Brazil is cheaper at both levels than Mexico, with a steeper curve. Colombia and Argentina point the same way but their sample sizes are too small for firm conclusions.
For US teams, the timezone overlap makes these markets work differently from India or Eastern Europe. That overlap has a cost value the salary table does not capture — see the limitations below.
Why this disagrees with our India figure, and why both are right
Our India cost article puts a mid-level Indian developer’s loaded cost at about $12.50 an hour. This article says $22.67. Same formula, different input.
The India article uses Payscale’s median for all software developers in India. This article uses Stack Overflow survey respondents. Those are different populations. People who complete a long English-language developer survey skew toward better-paid, more experienced, internationally connected engineers, and that skew is probably strongest in the lowest-paid markets.
So read the two as a range. The Payscale figure is closer to the typical Indian developer. The survey figure is closer to the developer an international client is likely to be working with. The same caution applies to every country in the table, which is why the index — each country measured against the US from the same source — is more reliable than any single dollar figure.
What this data does not capture
- Employer costs differ by country. A uniform 2.7x multiplier ignores that payroll taxes and mandatory benefits are much heavier in some countries (Brazil and much of Western Europe) than others. Countries with heavy employer contributions are understated.
- Compensation includes perks. The survey asks for total compensation, so part of what the multiplier covers is already in the input. This slightly overstates every country equally.
- Exchange rates are from June 2025. Currencies have moved since. The Indian rupee, for example, is weaker against the dollar now, which lowers India’s dollar cost.
- Coordination is not in the table. Timezone gaps, handover cycles and specification quality all change how many hours a project takes. Our India article covers this: an unclear specification increases hours much faster than a lower rate reduces them.
- Survey respondents are not a random sample. See the section above.
How to use this before you talk to a vendor
- Decide the seniority mix your project needs, not just the country.
- Take the developer cost by country for each seniority level from the table above as your floor.
- Ask every vendor to break their quote down by role and seniority.
- A rate well below the loaded cost for the seniority claimed means one of three things: juniors doing the work, utilisation the vendor cannot sustain, or margin recovered later through change requests.
If you want a second opinion on a quote, including one from a vendor competing with us, send it to us and we will walk through it line by line. If you are building a team rather than a single project, see how we structure dedicated developer teams.
Frequently asked questions
Which country has the cheapest software developers?
Among the 21 countries with enough data, Pakistan has the lowest mid-level cost at 10% of the US level, followed by India and Colombia at 13% (Colombia’s sample is small). At senior level, India is the lowest reported at 23%.
Is Eastern Europe cheaper than Latin America?
Not uniformly. Mexico and Brazil are cheaper than Poland, the Czech Republic and Romania at both mid and senior level in this data. Ukraine and Turkey are close to Mexico.
Why is the senior discount smaller than the mid-level discount?
Senior pay rises much more steeply with experience in lower-cost markets — 2.46x in India against 1.35x in the United States. The data shows this clearly. It does not explain why.
How was the loaded hourly cost calculated?
Median annual compensation, multiplied by 2.7 for employment overhead and margin, divided by 1,800 billable hours. The full method is above.
Can I use this data?
Yes. The CSV is released under the Open Database License 1.0. Credit “Ethersofts analysis of the Stack Overflow Developer Survey 2025” with a link to this page.